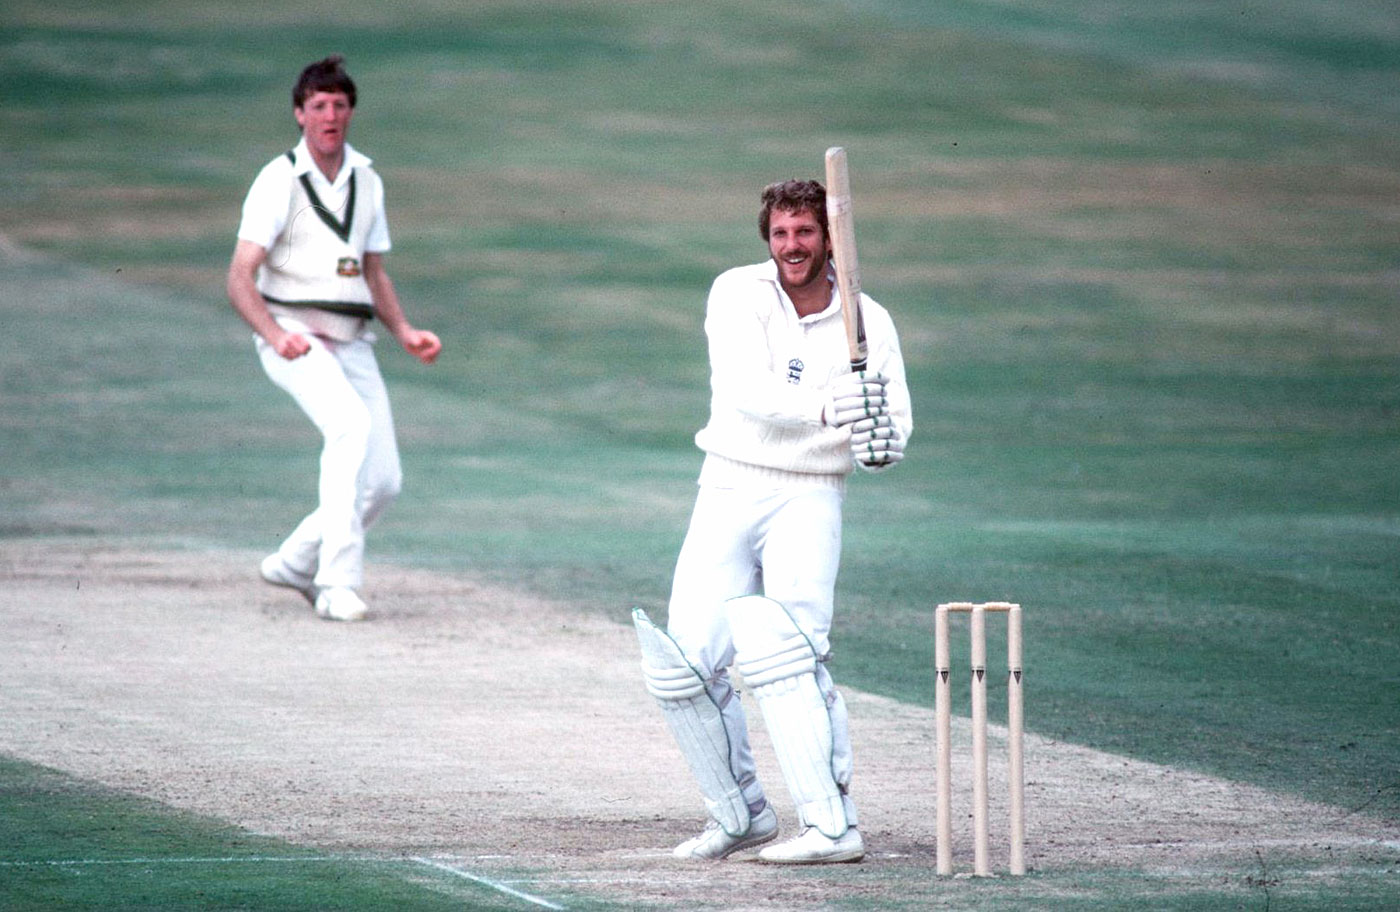
Ian Botham's epic 149 not out at Headingley in 1981 is worth 169% in terms of Real Value
The 'real value' of runs: where Root, Lara and Laxman shine)
An exhaustive analysis determining the worth of a batter's Test runs has a great allrounder as the biggest gainer
ANANTHA NARAYANAN | MARCH 5, 2022
H ow often have we encountered people saying things like, "The way he anchored the chase, the 96 was
worth much more than a hundred", or "There was nothing at stake, he just threw his bat around."
These seemingly objective statements are, in fact, wholly subjective. However, they do convey a message: the value of the runs scored in any given
innings could be considerably more or less than the actual figure. For the better part of 2021, I have been working on quantifying this aspect of the game.
How do we know the real value of runs? The scorecard already holds a lot of information about a match. What we need is a consistent and sound method to determine this value.
This exercise may remind readers of my Test Performance Analysis for innings and bowling spells. While some of the measures used are
common to both analyses, the two are different in nature, and these differences are highlighted later in this article. The bowling aspect will be covered in the next article,
a few months hence.
Let me outline the eight parameters that I will be using to determine the Real Value of runs scored.
1. Type of pitch
The tried, tested and accurate Pitch Quality Index measure I devised is used for this. If the PQI values for the first two innings and the
hird and fourth innings are available separately, these values are used. Otherwise the single match PQI value is used. The values for this factor are in a range of 0.913 to 1.173,
with a mean value of 1.003. These values are applicable for the 14,776 individual batting innings of 50 or above in Test history.
2. Opposing team's bowling strength
These are location-specific and career-to-date values. Many bowlers are kings in their own backyards but barely deliver when on the road.
Their fortunes move up and down during long careers. The recent form of bowlers is also incorporated. The values for this factor are in a range of 0.900 to 1.167; the mean value is 0.996
3. Location/Result/Relative Team Strength
This complex composite measure incorporates the Location (home/neutral/away), Result (win/draw/loss) and Relative Team Strength (very weak/weak/comparable/strong/very strong).
The combination of these factors provides a powerful and exhaustive 45-strong index value, providing a good handle on the nature of the result. For this factor, the range is 0.900 to 1.097, and the mean value 0.988.
The values for the first and second innings are pegged at a lower level than those for the third and fourth innings since the latter are the final innings for the respective teams.
High Scoring Index (HSI) + Innings Peer Value (IPV)
The HSI is a measure of the batting support the player received; players who played lone hands will benefit. The IPV is an indicator of where the player's
innings stands in relation to the average of the other 21 innings of the team; those who played standout innings will benefit. For this factor, the values are in the
0.930-1.166 range, and the mean value is 0.996.
5. Strike rate
I thought long and hard about this and decided to use a special and nuanced implementation of the metric - so alien to Test cricket culture - because some
innings that transcend the ordinary deserve recognition. There is no balls-faced information for well over half of all matches, but that does not mean batters in
those games get penalised in this exercise. I also needed to make sure that top-quality Test innings, such as 112 in 288 balls, are not penalised. The minimum value for this index is 1.00.
I cap the maximum strike rate at 200. I adopt a simple formula to reward Test innings with a strike rate in excess of 75. I also adjust the index of innings of above 100 runs slightly upwards if their strike rate is in excess of 75.
That means an innings with an undefined strike rate gets an index value of 1.00, one with a strike rate of 45 gets 1.00, 75 gets 1.00, 87.5 gets 1.01, 100 gets 1.02, 150 gets 1.06, and 200-plus gets the maximum value, 1.10. Viv
Richards' blitzkrieg of 110 in 58 balls gets the highest strike-rate index value of 1.104.

Brian Lara's match-winning 153 not out in 1999 against Australia has a Real Value of 214; conversely, his 400 not out against England is worth less than the scored runs, with a Real Value of 378 Ben Radford / © Getty Images
6. Match status
This is determined at the beginning of each team innings and is applied to all individual innings that team innings contains.
First innings: Default value of 1.00. There is nothing to go by. No information is available - on the scorecard - on atmospheric conditions, pitch conditions and level of batting difficulty.
Second innings: Depends on the first-innings score. If facing 500-plus, the index is capped at 1.10. If facing sub-100, it is fixed at 0.90. Anything in between,
the index is prorated between 0.90 and 1.10.
Fourth innings: Depends on the actual target and the Match-to-date Runs per Wicket. If the target is high relative to the average scores in the match, say a target of 250-plus when the Mtd_RpW is 20,
the index will have a high value; when the target is >=12.5 * Mtd_Rpw, the index is capped at 1.10. Conversely, low targets relative to the average runs per wicket will receive a low index value, fixed at the lower level at 0.90 when the target is <=2.5 * Mtd_RpW. For anything in between, the index is prorated between 0.90 and 1.10
This factor has a range of 0.900 to 1.100 and a mean value of 1.014.
7. Innings status
This is a complex measure. What was the (innings-specific) team target? What was the innings position when the player came in to bat? How far away or close was the target? What was the projected score?
Did a wicket fall soon after the player came in? Based on these facts, the innings status is measured. This factor has a range of 0.910 to 1.185 and a mean value of 0.988.
Minor adjustments to match status values (see above) are effected depending on the innings status values. For instance, if the team batting first scores 500, the match status index for
the second team will be 1.10, but if a player walks in at a comfortable 200 for 1, that 1.10 is downgraded dynamically. Similarly, in the case of a first-innings total of 95, where a player walks in at 30 for 4 in the second,
the index value of 0.90 will be dynamically upgraded.
8. Slack Runs and Margin
To start with, I had applied the seven parameters above and took a look at the results. Two hundreds were in top positions. The lower-placed one was in a tough 29-run
win and the higher-placed innings in a comfortable 297-run win. I realised then that there was a need to acknowledge the margin to make sure that the complete match context was incorporated.
With this ninth parameter, I take into account the final margins of wins and rationalise them, bringing in the concept of Slack Runs. This has also allowed me to acknowledge
some aspects of hard-fought draws. I may not be able to adequately reward innings where runs scored are low, such as Rachin Ravindra's recent 18 not out off 91 balls in Kanpur, but I am able to recognise
important match-saving innings where a decent amount of runs were scored - such as Faf Du Plessis' unbeaten 110 off 376 in Adelaide. This is a highly nuanced parameter. The factor has a range of 0.950 to 1.100 and a mean value of 0.998.
In summary
Innings played on tough pitches will be valued highly; those played in batter-friendly conditions will lose out. Innings against top-quality bowling attacks will benefit; those against run-of-the-mill attacks will not be
rewarded. Innings that helped teams win away will benefit. Also, innings against stronger teams. Wins matter - so do heroic efforts to save matches. If a batter receives excellent support, his innings will stand to lose, as against lone-wolf innings.
nnings that come in tough match/innings situations will gain a lot. The closer the result is, the greater the value of the innings will be. Finally, quick innings will receive some benefit, though ones that are not will not lose out unduly.
Multiplicative vs additive
There are two ways to achieve the final Real Value Factor. One is to multiply the actual values of each parameter for each innings. For instance: 0.962 * 0.908 * 1.068 * 1.059 * 0.984 * 1.017 *1.00 * 1.014 = 1.002.
The other is to add the values (differences from 1.0) to the base index value of 1.0: (1.000 - 0.038 - 0.092 + 0.068 + 0.059 - 0.016 + 0.017 + 0.00 + 0.014 = 1.012), which produces about 1% variation. Both these routes offer
similar results and differ by a factor well below 2.5% in most cases.
After studying the summary values for randomly selected individual innings across many dry runs, I decided on the multiplicative route since that way the parameters had stronger and
sharper impact on the final valuation. Even if the additive route had been taken, the results would have been quite close to what we have here. When all parameters have narrow, well-defined bands of values,
the additive and multiplicative routes often converge.
The calculation process
The eight parameters are determined for each innings. A few of these are at the player-innings level, a few at team-innings level, and a few at match level.
Then the Real Value of the innings is determined by multiplying the actual runs scored by the final Real Value Factor. To ensure a proper and balanced implementation of the process, low sub-100 scores are pushed up slightly and high 200+
scores are pulled down slightly. These adjusted values are then compiled at the career level by adding up the Real Values for each innings by a player.
A schematic of the process is given below. Please read clockwise starting from the top.

© Anantha Narayanan
Let me illustrate the process with three innings - the first a recent masterpiece, the second an old classic, the third a big but not extraordinary innings.
Let us take Dhananjaya de Silva's 155 not out in Galle against West Indies. The values of the eight parameters are: PQI=1.071, Bow=1.040, LRT=1.000, H-I=1.040, MSt=1.024, ISt=0.997, SR=1.000 and SlkR=1.051.
The Real Value Factor is 1.243. The Real Value of this 155 is 193 (155 * 1.243).
Take Mark Butcher's match-winning 173 not out against Australia in Leeds in 2001. The eight parameters are: PQI=0.984, Bow=1.137, LRT=1.075, H-I=1.036, MSt=1.020, ISt=0.987, SR=1.018, and SlkR=1.010.
(Note the credit for the good strike rate of 76.2.) The Real Value Factor is 1.291. The Real Value of the innings is 223. Almost all the factors are positive.
Now for Hashim Amla's good-but-not-great innings of 208, in a Test that South Africa won against West Indies in Centurion in 2014. The eight parameters are: PQI=0.993, Bow=0.908, LRT=1.005, H-I=1.003, MSt=1.000, ISt=0.967, SR=1.000 and SlkR=0.974.
The Real Value Factor is 0.855. The Real Value of 208 is 178.